Operator Analytics Dashboard
We build marketplace and directory analytics dashboards that bring listings, bookings, search behavior, revenue signals, and growth decisions into one operational view.
Build focus
Event tracking · Dashboard UX
Best fit
Marketplace operators · Directory owners

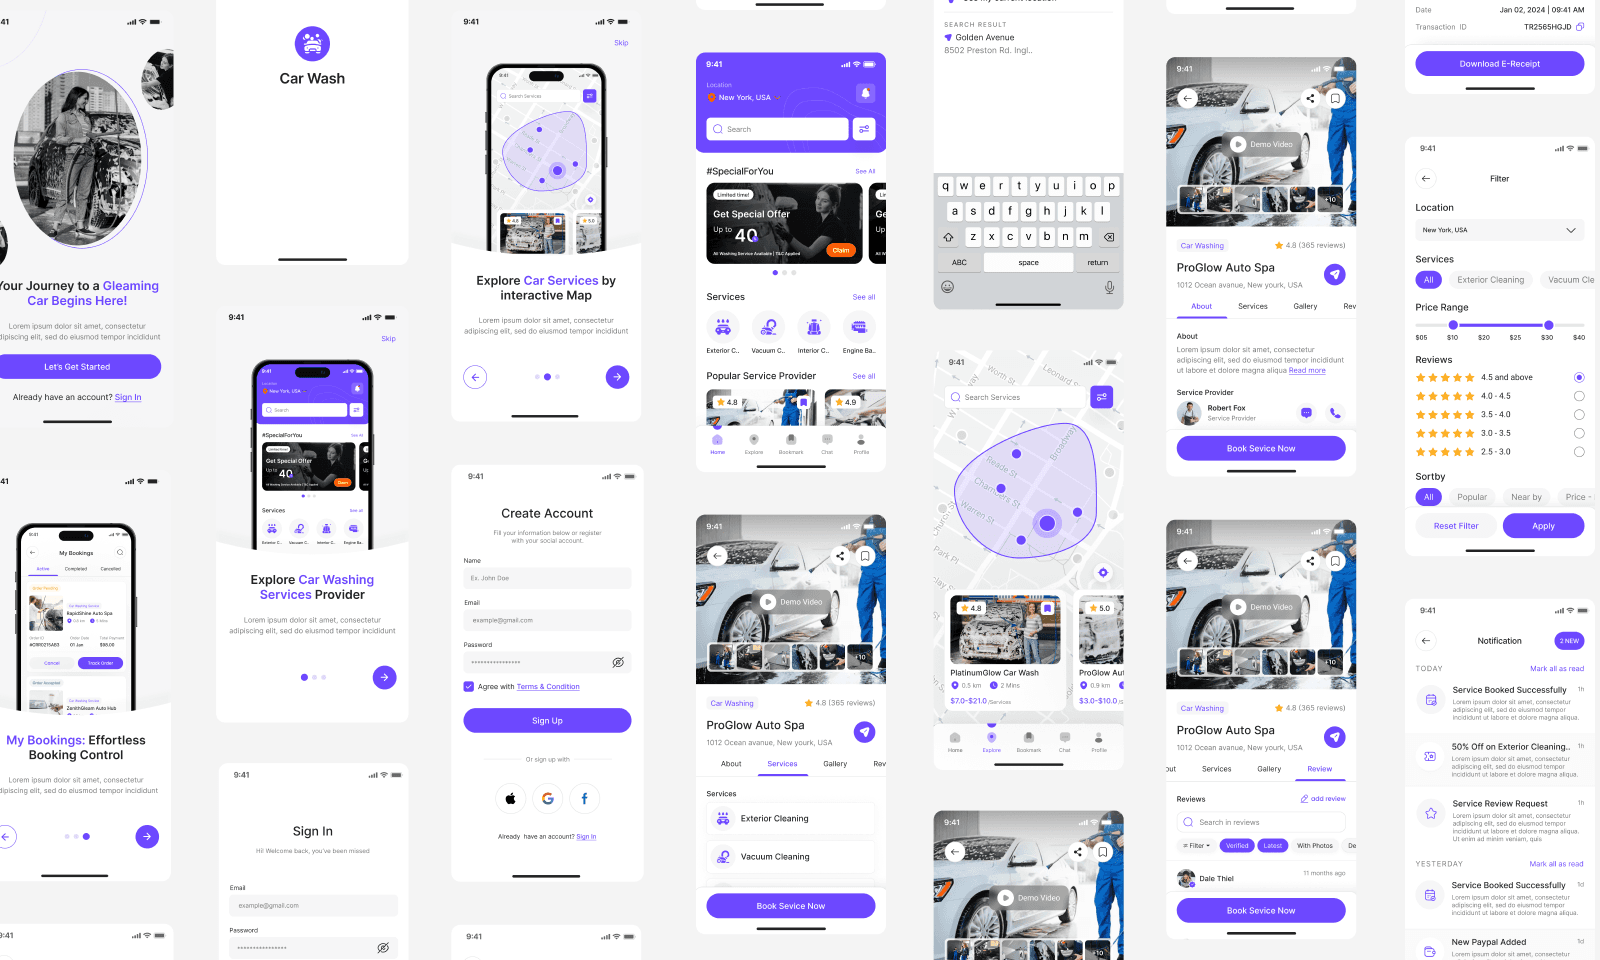
Illustrative marketplace interface concept, not a client screenshot. Any displayed data is illustrative.
Custom Capability
What We Can Build for Your Platform
We adapt this capability to your marketplace model, users, operations, and existing stack, so it supports how your business actually works.
What It Helps You Improve
What we design
Our Build Approach
How We Turn It Into a Working Product
We connect customer actions, operator rules, revenue paths, and technical constraints so the feature works as part of the wider business, rather than as an isolated plugin.
Business need
What we design
Where it fits
Operator Intelligence
Marketplace Analytics Should Point to the Next Operating Decision
Growth dashboards are useful only when they connect acquisition, search, listings, bookings, revenue, and operational workload into decisions the team can act on.
Decision Metrics
Dashboards should show what is changing, where friction appears, and what deserves attention next.
Demand Signals
Searches, listing views, filters, lead events, and booking intent reveal where demand is forming or leaking.
Supply Health
Provider quality, listing completeness, response time, availability, and support load need visibility.
Growth Feedback
Paid traffic, SEO, content, and lifecycle automation work better when the platform reports what converts.
How We Build
How We Build It
Define the operating questions
Start with what the founder or team needs to decide: acquisition, liquidity, quality, revenue, or workload.
Map the event layer
Connect searches, listing views, leads, bookings, payments, messages, and admin actions to useful reports.
Design the dashboard experience
Build views for the people who act on the data, not only summary charts for presentation.
Tie insights to growth work
Use the dashboard to guide SEO, paid campaigns, listing quality, automation, and product improvements.
Growth Analytics
For teams that need platform reporting tied to traffic, leads, bookings, revenue, and operational decisions.
View Analytics ServiceAI Agents
For operators who want assistants that summarize leads, triage issues, and turn platform data into action.
Explore AI AgentsExplore a Similar Build
Need dashboards that drive better marketplace decisions?
We can map the operating questions, event tracking, dashboard views, and growth actions around your platform model.
Continue Exploring
Related Marketplace and Directory Work
Explore other client projects and custom capabilities that may be relevant to your platform.
.png&w=3840&q=75)